Project on Data Visualisation with Python
Self-paced videos, Lifetime access, Study material, Certification prep, Technical support, Course Completion Certificate
Uplatz
Summary
- Uplatz Certificate of Completion - Free
Add to basket or enquire
Overview
Uplatz provides this in-depth course on Project on Data Visualisation with Python. It is a self-paced course consisting of video tutorials. You will be awarded Course Completion Certificate at the end of the course.
Data Visualisation is the graphical representation of data in order to interactively and efficiently convey insights to clients, customers, and stakeholders in general.
One of the key skills of a data scientist is the ability to tell a compelling story, visualizing data and findings in an approachable and stimulating way. Learning how to leverage a software tool to visualize data will also enable you to extract information, better understand the data, and make more effective decisions.
Data Visualisation is the process of communicating complex information with simple graphics and charts. Data Visualisation has the power to tell data-driven stories while allowing people to see patterns and relationships found in data.
Python allows us to create visualizations easily and quickly using Matplotlib and Seaborn. Matplotlib is the most commonly used graphing tool in Python. Seaborn is an add-on to Matplotlib that allows us to style our graphs more professionally and create sleeker graphics.
Course media
Description
The main goal of this Project on Data Visualisation with Python course by Uplatz is to teach you how to take data that at first glance has little meaning and present that data in a form that makes sense to people. You will learn how to: Create line graphs, Create bar charts, Create pie graphs, Add error bars to graphs, Add labels and styling to graphs, and the like.
In this complete industry-driven Project on Data Visualization with Python you will learn the analysis and visualization of Python. The tutor has demonstrated the analysis and visualisation of Covid-19 datasets with the help of Python. With this course you will learn how to apply the concepts of Python Data Visualization on practical projects or applications, and in real world scenarios.
Who is this course for?
Everyone
Requirements
Passion and determination to succeed!
Career path
- Data Visualisation Analyst
- Data Visualisation Developer
- Data Visualisation Engineer
- Data Analyst
- Data Scientist
- Data Engineer
- MI Analyst
- Reporting Analyst
- Python Programmer
- BI Developer
- Data & Analytics Professional
- Data Consultant
- Software Engineer
- Software Developer
Questions and answers
Currently there are no Q&As for this course. Be the first to ask a question.
Certificates
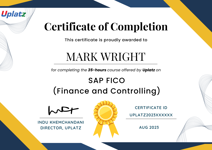
Uplatz Certificate of Completion
Digital certificate - Included
Course Completion Certificate by Uplatz
Reviews
Currently there are no reviews for this course. Be the first to leave a review.
Legal information
This course is advertised on reed.co.uk by the Course Provider, whose terms and conditions apply. Purchases are made directly from the Course Provider, and as such, content and materials are supplied by the Course Provider directly. Reed is acting as agent and not reseller in relation to this course. Reed's only responsibility is to facilitate your payment for the course. It is your responsibility to review and agree to the Course Provider's terms and conditions and satisfy yourself as to the suitability of the course you intend to purchase. Reed will not have any responsibility for the content of the course and/or associated materials.


